Изменение целевой группы: Технические специалисты
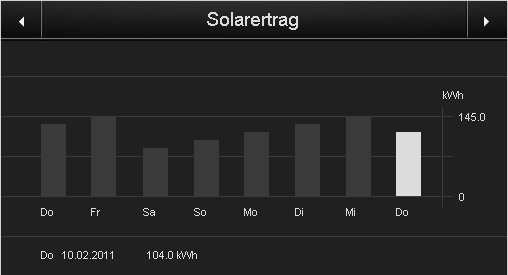
Measured values for the current day and the past 7 days are shown within the MiniVisu in a bar graph. Arrow keys are used to navigate through the period considered. The current daily value, day of the week, and date are shown for each day. Measured values are prepared and saved within the logic.
Note: Ensure that the measured value is received once daily at the most.
As an example, the bar graph can be used to show solar generation values, meter readings or temperature values of the current day and past 7 days.
Hard- und Softwareversionen: Gira HomeServer from Version 2.6, QuadClient version 1.1
Gira Hardware: 1x 052900 Gira HomeServer 4 KNX
Realisierungsdauer: 0.75 hr. / design
